Notice
Recent Posts
Recent Comments
Link
| 일 | 월 | 화 | 수 | 목 | 금 | 토 |
|---|---|---|---|---|---|---|
| 1 | 2 | 3 | 4 | 5 | 6 | 7 |
| 8 | 9 | 10 | 11 | 12 | 13 | 14 |
| 15 | 16 | 17 | 18 | 19 | 20 | 21 |
| 22 | 23 | 24 | 25 | 26 | 27 | 28 |
Tags
- tableView
- combine
- rxswift
- 애니메이션
- 스위프트
- 리팩토링
- SWIFT
- 리펙토링
- Xcode
- ribs
- scrollview
- uitableview
- Refactoring
- Observable
- UICollectionView
- collectionview
- HIG
- swiftUI
- swift documentation
- Clean Code
- clean architecture
- 클린 코드
- RxCocoa
- UITextView
- MVVM
- ios
- Protocol
- map
- uiscrollview
- Human interface guide
Archives
- Today
- Total
김종권의 iOS 앱 개발 알아가기
[iOS - SwiftUI] 1. Swift Charts 사용 방법 (#주식 차트, 주가) - BarMark 본문
iOS 응용 (SwiftUI)
[iOS - SwiftUI] 1. Swift Charts 사용 방법 (#주식 차트, 주가) - BarMark
jake-kim 2023. 11. 2. 01:071. Swift Charts 사용 방법 (#주식 차트, 주가) - BarMark
2. Swift Charts 사용 방법 (#주식 차트, 주가) - LineMark, RuleMark

Swift Chart 개념
- iOS 16+에서 사용가능
- SwiftUI에서 제공하는 Chart를 사용하면 매우 쉽게 차트 그리기가 가능

Swift Chart 사용 방법
- import Charts로 모듈 import
import SwiftUI
import Charts- 차트에 들어갈 모델 정의
struct ToyShape: Identifiable {
    var type: String
    var count: Double
    var id = UUID()
}- data정의
struct ContentView: View {
    var data: [ToyShape] = [
        .init(type: "Cube", count: 5),
        .init(type: "Sphere", count: 4),
        .init(type: "Pyramid", count: 4)
    ]
}- body에 뷰 구현
- Chart 블록 안에 BarMark를 삽입
- VarMark는 단순히 label, x, y 좌표가있는 형태
    var body: some View {
        Chart {
            ForEach(data) { shape in
                BarMark(
                    x: .value("Shape Type", shape.type),
                    y: .value("Total Count", shape.count)
                )
            }
        }
    }

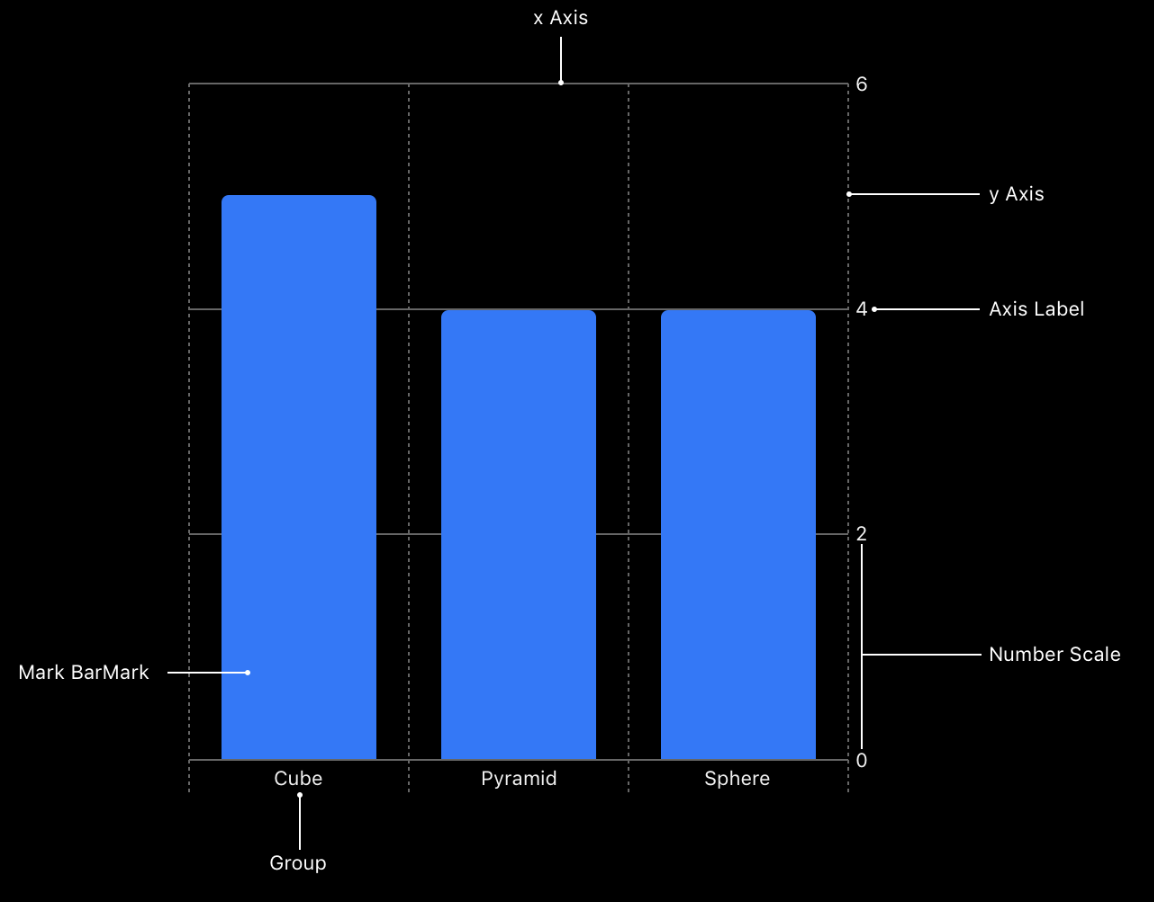
- 차트 구조
- 내부 코드로 인해 자동으로 Axis Label도 달아주는것이 포인트

위에는 x좌표만 분류했지만 색상으로도 분류하고 싶은 경우?
- BarMark 블록에 foregroundStyle(by:) 메소드 사용
- by안에 들어가는 값은 .value("Shape Color", colorNameString) 와 같이 주입
ex)

- 모델에 color 추가
struct ToyShape: Identifiable {
    var color: String // <-
    var type: String
    var count: Double
    var id = UUID()
}- data에 color 값 적용
    var data: [ToyShape] = [
        .init(color: "Green", type: "Cube", count: 2),
        .init(color: "Green", type: "Sphere", count: 0),
        .init(color: "Green", type: "Pyramid", count: 1),
        .init(color: "Purple", type: "Cube", count: 1),
        .init(color: "Purple", type: "Sphere", count: 1),
        .init(color: "Purple", type: "Pyramid", count: 1),
        .init(color: "Pink", type: "Cube", count: 1),
        .init(color: "Pink", type: "Sphere", count: 2),
        .init(color: "Pink", type: "Pyramid", count: 0),
        .init(color: "Yellow", type: "Cube", count: 1),
        .init(color: "Yellow", type: "Sphere", count: 1),
        .init(color: "Yellow", type: "Pyramid", count: 2)
]- BarMark에 foregroundStyle(by:) 추가
var body: some View {
    Chart {
        ForEach(data) { shape in
            BarMark(
                x: .value("Shape Type", shape.type),
                y: .value("Total Count", shape.count)
            )
            .foregroundStyle(by: .value("Shape Color", shape.color)) // <-
        }
    }
}- .value에 들어가는 shape.color를 설정하면 자동으로 색상 legend도 적용

* 전체 코드: https://github.com/JK0369/ExBarMark
* 참고
https://developer.apple.com/documentation/charts/creating-a-chart-using-swift-charts
'iOS 응용 (SwiftUI)' 카테고리의 다른 글
Comments


